import pandas as pd
import numpy as np
import matplotlib.pyplot as plt
import seaborn as sns
import matplotlib.font_manager as fm
import matplotlib as mpl
import plotly.express as px
from wordcloud import WordCloud, STOPWORDS, ImageColorGenerator
from PIL import Image
from google.colab import drive
drive.mount('/content/drive')
1. Check data (missing values, descriptive statistics)
data = pd.read_csv('/content/sample_data/vgsales.csv')

data.head()

import missingno as msno

msno.matrix(df = data.iloc[:, :], figsize=(8, 8), color=(0.5, 0.6, 0.8));

data.isnull().sum()

#결측 데이터 제거
data = data.dropna(axis = 0)

data.shape
data.describe()
data['cate_year'] = pd.cut(data.Year, bins=[1980, 1990, 2000, 2010, 2020], labels=['80년대', '90년대', '2000년대', '2010년 이후'])
2. Game Revenue Trend
%matplotlib inline

x = np.arange(1980, 2019, 1)

#year를 기준으로 count pivot table 생성
datayearpivot = data.pivot_table(index=['Year'], aggfunc='count')
y = datayearpivot['Rank']

data_year_sum = data.groupby('Year').sum()
y2 = data_year_sum['Global_Sales']

fig = plt.figure(figsize=(15, 7))
ax11 = fig.add_subplot(111)
ax11.plot(x, y, label = 'Count')

#twinx는 같은 x축을 쓰는 plot
ax12 = ax11.twinx()
ax12.plot(x, y2, '--', label = 'Sales')

ax11.legend(loc=2, fontsize=15)
ax12.legend(loc=0, fontsize=15)
ax11.grid()
ax11.set_xlabel('Year', fontsize=15)
ax11.set_ylabel('Count', fontsize=15)
ax12.set_ylabel('Sales', fontsize=15)
ax12.set_title('Games Count & Sales per Year', fontsize=20)

ax12.annotate('Sales Maximum',
            xy=(2008, 678.90), xycoords='data', xytext=(-100, -10), textcoords='offset points',
            arrowprops=dict(arrowstyle="->", connectionstyle="arc3,rad=-0.5"))
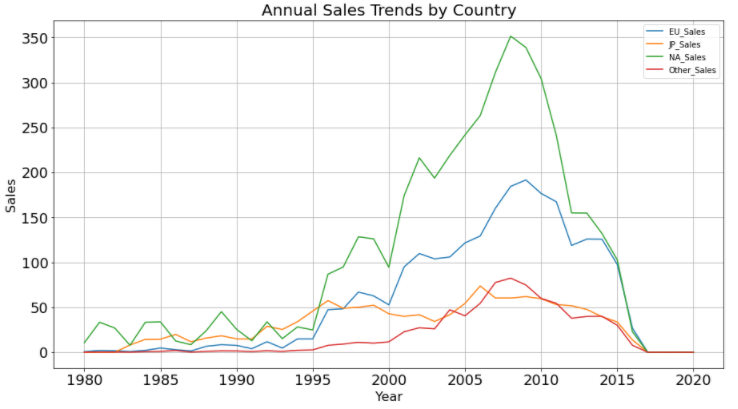
national_sales = pd.pivot_table(data, values=('NA_Sales', 'EU_Sales', 'JP_Sales', 'Other_Sales'),
                                index = ['Year'], aggfunc = np.sum).sort_values(by = 'Year', ascending = True)

ax = national_sales.plot(kind = 'line', figsize = (15, 8), fontsize = 18)
ax.set_title('Annual Sales Trends by Country', fontsize=20)
ax.grid()
ax.set_xlabel('Year', fontsize=16)
ax.set_ylabel('Sales', fontsize=16)
game_group2 = game_group[['NA_Sales',	'EU_Sales',	'JP_Sales',	'Other_Sales',	'Global_Sales']]
game_group2

plt.figure(figsize=(20,13))

sns.heatmap(game_group2, cmap=sns.light_palette(
    "gray", as_cmap=True), annot=True, fmt='.1f')
plt.title("Heatmap")
plt.show()

. Top Platform & Genre
plt.figure(figsize=(15, 5))

ax21 = sns.countplot('Platform', data = data, order = data['Platform'].value_counts().index, palette='bone')
ax21.set_title('Preferred Platform', fontsize=20)

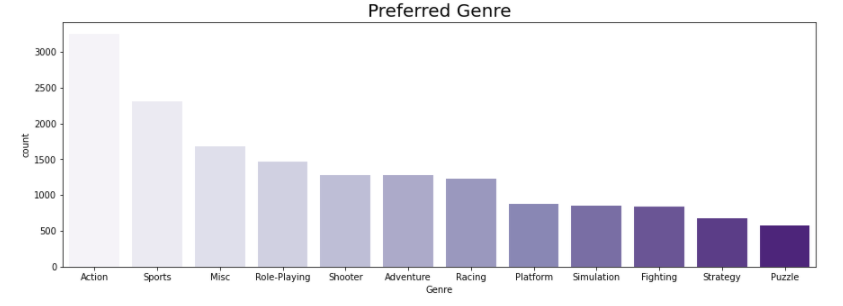
plt.figure(figsize=(15, 5))

ax21 = sns.countplot('Genre', data = data, order = data['Genre'].value_counts().index, palette='Purples')
ax21.set_title('Preferred Genre', fontsize=20)
genre_top5 = pd.DataFrame(game_group['Global_Sales'].reset_index('Genre').sort_values(by='Global_Sales', ascending=False)).head(5)
labels = genre_top5['Genre']
colors = plt.cm.Reds(np.linspace(0, 5, 30))

#plt.title('sales top 5 genre', fontsize=20)
#plt.pie(genre_top5['Global_Sales'], labels=labels, shadow=True, startangle= 90, colors=colors, autopct='%.1f');


fig = px.pie(genre_top5, values='Global_Sales', names=genre_top5['Genre'], title='Publishers Global Market Share (%)')
fig.update_traces(textposition='inside', textinfo='percent+label', textfont_size=20)
fig.update_layout(
    autosize=False,
    width=500,
    height=500)
. Top 10 Preferred Games by Genre
data['Genre'].unique()

action = data[data['Genre']=='Action']
sports = data[data['Genre']=='Sports']
shooter = data[data['Genre']=='Shooter']

action_group = action.groupby('Name').sum()
action_group = action_group.sort_values(by=['Global_Sales'], ascending=False).head(10).reset_index('Name')

plt.rcParams['figure.figsize'] = (20, 7)
ax = sns.barplot(x = action_group['Name'], y = action_group['Global_Sales'], palette='magma')
plt.xticks(fontsize = 13, rotation = 45)
plt.title(label = 'Top 10 games in action genre', fontsize = 20)
ax.set_xlabel('Name', fontsize=16)
ax.set_ylabel('Sales', fontsize=16)

sports_group = sports.groupby('Name').sum()
sports_group = sports_group.sort_values(by=['Global_Sales'], ascending=False).head(10).reset_index('Name')

plt.rcParams['figure.figsize'] = (20, 7)
ax = sns.barplot(x = sports_group['Name'], y = sports_group['Global_Sales'], palette='hls')
plt.xticks(fontsize = 13, rotation = 45)
plt.title(label = 'Top 10 games in sports genre', fontsize = 20)
ax.set_xlabel('Name', fontsize=16)
ax.set_ylabel('Sales', fontsize=16)
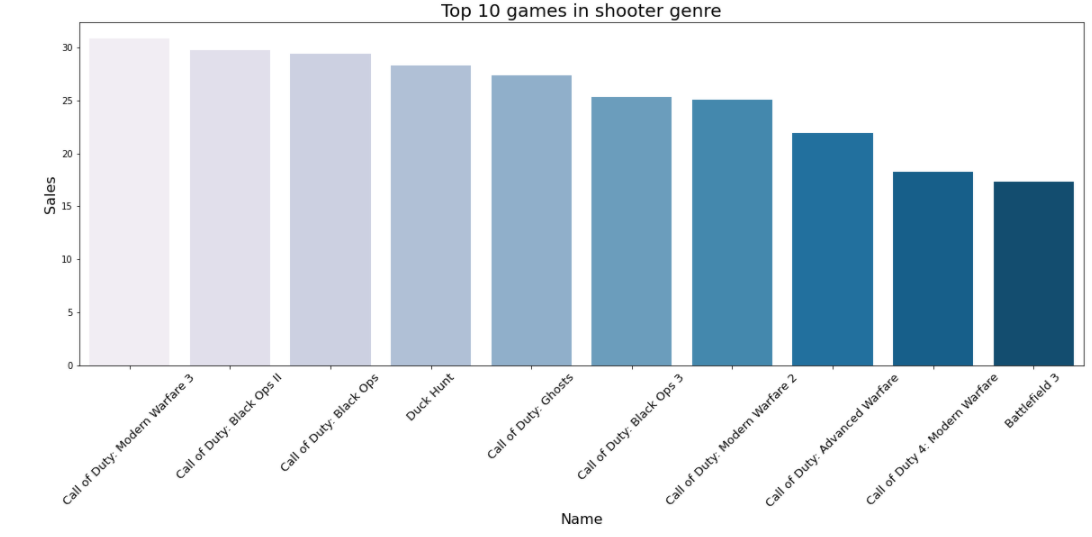
shooter_group = shooter.groupby('Name').sum()
shooter_group = shooter_group.sort_values(by=['Global_Sales'], ascending=False).head(10).reset_index('Name')

plt.rcParams['figure.figsize'] = (20, 7)
ax = sns.barplot(x = shooter_group['Name'], y = shooter_group['Global_Sales'], palette='PuBu')
plt.xticks(fontsize = 13, rotation = 45)
plt.title(label = 'Top 10 games in shooter genre', fontsize = 20)
ax.set_xlabel('Name', fontsize=16)
ax.set_ylabel('Sales', fontsize=16)
'Data Science > Python' 카테고리의 다른 글
| 정부 API로 josn 파싱하기 (0) | 2021.03.02 |
|---|---|
| 지수 표기 숫자로 변환하여 표현하기 (0) | 2021.02.23 |
| Python 결측치 처리 (0) | 2021.01.14 |
| python으로 카이제곱 검정 (0) | 2021.01.06 |
| Python으로 T-test (0) | 2021.01.05 |


